
Use cases · Research & universities
Weather and climate data, ready for your next paper.
Researchers and students use Flowershift for gridded history, AI forecasts with ensembles, and verification data, in the formats your analysis already uses.
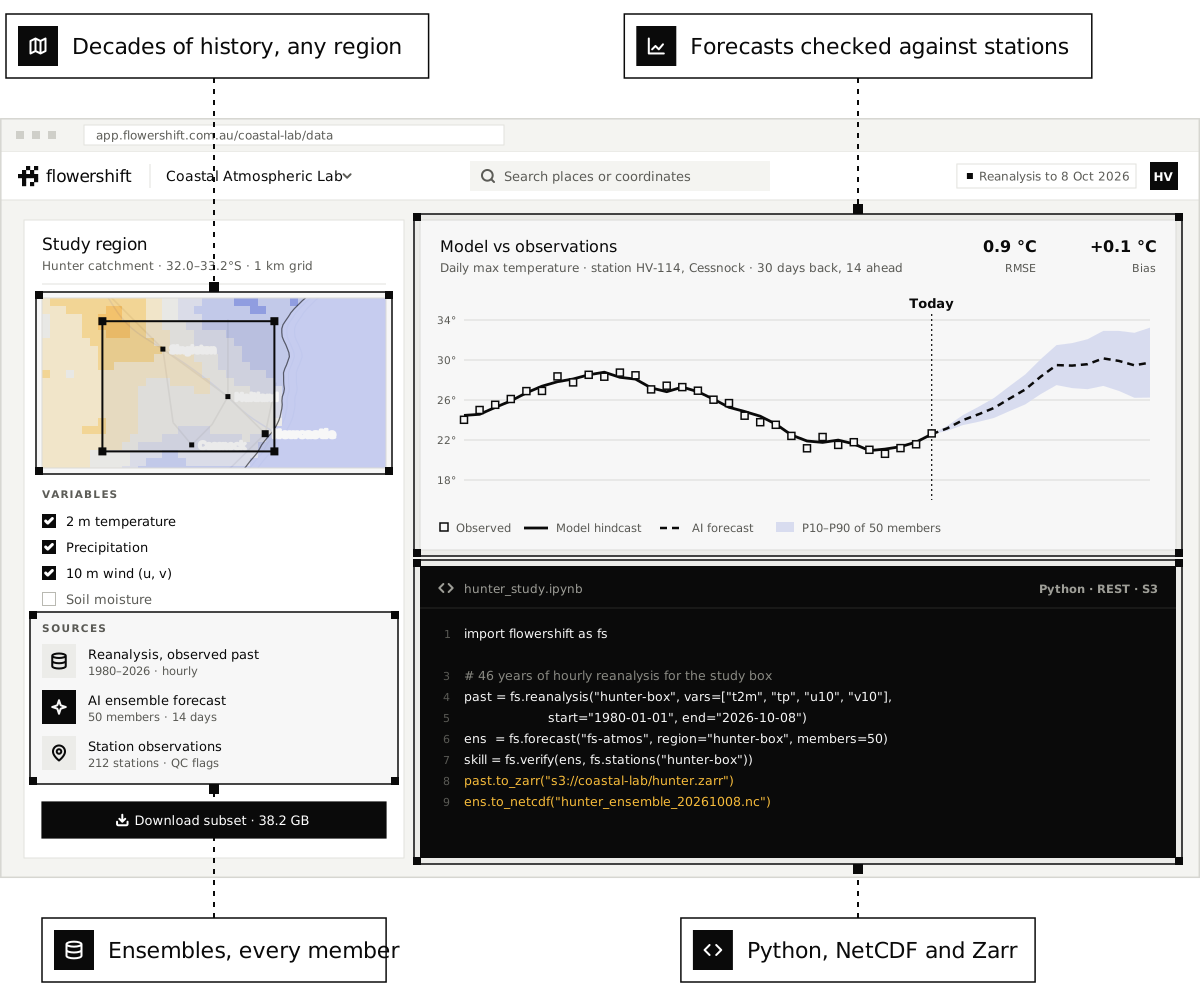
- of gridded history
- 70 years
- of gridded history
- forecast and reanalysis grid
- 1 km
- forecast and reanalysis grid
- Zarr, CSV and Parquet
- NetCDF
- Zarr, CSV and Parquet
Research & universities
How teams use it.
History and forecasts together
Decades of gridded observations and our AI forecasts on the same grid, so you can study the past and test predictions.
Ensembles and verification
Every forecast comes with its ensemble members and how it scored against what was observed.
Fits your workflow
Download areas and periods, or pull data straight into Python, R or a notebook through the API.
From a single site to a whole study region.
Draw a study region, choose variables and dates, and export, or query the API from your own code. Lab and department plans cover a whole team.
- Temperature, rain, wind, humidity, pressure and more
- Ensemble members and p10 to p90 ranges
- Forecast verification against stations
- Bring your own sensors and compare
- Lab and department plans
Features used
Questions.
Is there academic pricing?
Can I cite Flowershift data in a paper?
Can we add our own sensors?
Start with the data.
Sign up and download a study region today, or talk to us about a lab or department plan.
See pricing
Pay per location, alert and API call. No lock-in, and a cap so there are no surprises.
Sign up
Add your first locations and alerts in a couple of minutes and try it yourself.